Record the environment
Log Mac model, chip, RAM, macOS, AppHalt version, tested app version, power source and starting battery level.
AppHalt Benchmark Lab · protocol v1.0
See a measured pause-and-resume demonstration, inspect the raw samples, and use our longer protocol to test your own workload. Each result is tied to the app and conditions actually measured.
Measured on 3 October 2026 · synthetic pilot
We created a small native test app named Pause Test with one background worker: a 25 ms busy loop followed by a 75 ms sleep. We used the installed AppHalt interface to pause and resume it, without closing the app.
| Cycle | Before pause | Paused | Resumed |
|---|---|---|---|
| 1 | 17.53% | 0.00% | 16.41% |
| 2 | 14.31% | 0.00% | 13.79% |
| 3 | 12.86% | 0.00% | 12.08% |
What this demonstrates: the synthetic app’s accumulated CPU time stopped increasing at the collector’s resolution while AppHalt held it paused, and increased again after Resume. This is a reversible execution-control result on this test app.
What it does not demonstrate: extra battery hours, higher gaming FPS, a faster Mac, released RAM or the behavior of Chrome’s multiple processes. An app that was already idle may offer little activity to reduce.
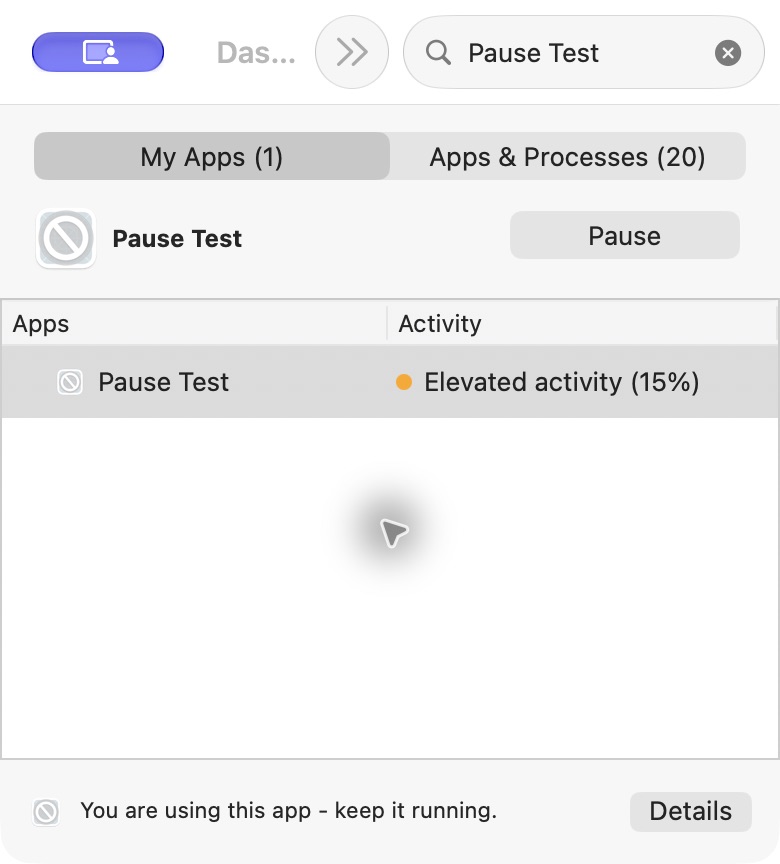
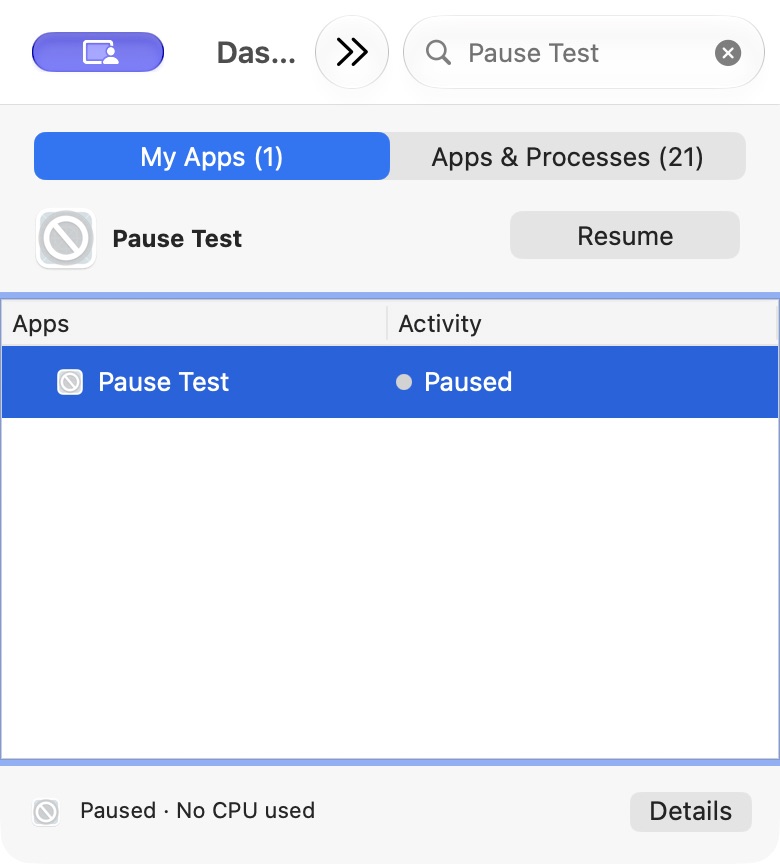
Apple M2, Mac model Mac14,2, 8 GiB RAM, macOS 27.2 (26B5091g), AppHalt 1.9.7 build 19701, AC power. Other normal work continued on the Mac. Each condition contains twelve approximately five-second samples. CPU percentage is the change in process CPU time reported by ps, divided by elapsed monotonic time, multiplied by 100.
All three cycles use active → paused → resumed order. One overlapping collection window was excluded and repeated; its samples remain in the CSV and the reason is recorded in the JSON. A displayed 0.00% means no CPU-time increase at the collector’s 0.01-second resolution. This short pilot differs from the ten-minute protocol below and is not a statistically representative performance study.
Save the Swift source as main.swift, the collector as measure.py, and the build script as build.sh in a new directory. Run sh build.sh on a development Mac with the Xcode command-line tools. The script compiles the Swift source with swiftc into a macOS app bundle named Pause Test, with executable PauseTest and bundle identifier app.apphalt.measurementfixture. Launch only that test app, let it settle, and run the collector with a cycle label and condition, for example python3 measure.py 1 active. Wait for collection to finish, pause the test app using AppHalt, collect 1 paused, then resume it and collect 1 resumed. Repeat three times. Save all runs and record your own environment. Do not substitute your working browser for the isolated fixture.
For a real browser workflow, follow the Chrome checklist. For interpretation, read the energy guide or gaming diagnostic.
The ten-minute protocol below remains the plan for real-world app comparisons. The synthetic pilot above has its own shorter method and raw samples. The empty template is for future studies; it is not the pilot dataset.
Reproducible protocol
The core comparison is the same app and workload in three states: active but idle, paused with AppHalt, and resumed.
Log Mac model, chip, RAM, macOS, AppHalt version, tested app version, power source and starting battery level.
Use the same open documents, tabs, project or call preparation in every run. Do not compare unrelated sessions.
Let startup, indexing and initial network bursts settle. Record unusual system activity in the notes.
Capture average CPU and Energy Impact over the full window, plus memory allocation and system memory pressure.
Alternate condition order where practical. Keep null, noisy and unfavorable runs rather than removing them silently.
Confirm the app returns, note reconnections or interruptions, and report any workflow side effect alongside system metrics.
Metrics
| Metric | Reason | Interpretation limit |
|---|---|---|
| Average CPU % | Shows processor activity across the fixed interval | A single instant is not representative; processor percentages fluctuate |
| Average Energy Impact | Apple’s relative indicator for current app energy use | It is not a direct battery-life percentage |
| App memory and memory pressure | Separates allocation from actual system memory stress | Pausing does not promise to free the app’s RAM |
| Workflow outcome | Records reconnects, stopped transfers or other user-visible costs | A lower metric is not useful if required work was interrupted |
| Battery level, only in long tests | Can support a controlled laptop scenario | Short tests, screen brightness and wireless activity make broad claims unreliable |
Planned evidence cases
These are registered test scenarios, not completed case-study results.
Foreground: one document editor.
Background candidates: browser, chat and music apps left idle.
Report: CPU, Energy Impact, memory pressure and missed notifications after resume.
Foreground: a call app that remains excluded.
Background candidates: unrelated browser, creative and developer tools.
Report: system metrics plus call stability; never pause the active call app.
Foreground: editor and required local services remain active.
Background candidates: unrelated communication and design apps.
Report: metrics plus any affected watchers, servers or helper processes.
Publication rules
Publish every valid run, not only the strongest result. Explain exclusions and preserve the original row.
A result applies to the recorded Mac, app versions and workload. It does not become a guarantee for every user.
Every dataset identifies the AppHalt version and date so old evidence is not presented as current indefinitely.
If an idle app was already doing almost nothing, the pause may show little measurable difference. That outcome belongs in the dataset.
Reconnects, stopped notifications and interrupted tasks are reported next to performance metrics.
Material changes receive a dated correction note rather than silently replacing the claim.
Measurement references
Evaluate it yourself
The public template lets you keep a comparable record instead of relying on a marketing percentage.
No guaranteed gain. Keep the result that your Mac actually shows.